
Bad Opening Hands
Opening almost unplayable hands has probably happened to everyone of us before. When you notice, however, that your opening hands are not what you want them to be on a regular basis, there might be some flaws in the ratios you picked when building your deck. In the current combo-heavy format with
Maybe you have built decks in the past with which you could not get your plays started more often than not. When you do not draw your starter cards on a regular basis, you cannot get your plays going, which will make you lose the game. In all of these cases it might very well be that mathematics was not in your favor. Perhaps you even thought about your ratios, but you did not know how to correctly calculate the probabilities involved. However, knowing how to calculate those probabilities is crucial to building competitive decks. This is why we are going to explore the underlying mathematics in this article.


The Hypergeometric Distribution
The distribution needed to calculate the probabilities in question is the hypergeometric distribution. In this section of the article we are going to take a closer look at the probability mass function of the hypergeometric distribution. You do not have to understand all the mathematics involved in order to make use of the distribution. If you are not interested in the mathematics of the hypergeometric distribution at all, you can also skip to the next section of the article.

With the hypergeometric distribution we can calculate the probability to draw k cards out of a selection of K cards in a sample of s cards included in a deck of n cards. In order to calculate it we need two functions from combinatorics, namely the factorial and the binomial coefficient. The expression n! for a positive integer n is called the factorial of n. Here, n! does not mean that we shout the number n loudly. Instead, n! is simply a shorthand notation for the product of the first n numbers. For example, 5!=5×4×3×2×1 or 7!=7×6×5×4×3×2×1. In general, n!=n×(n−1)×…×2×1.
The number n! tells us the number of ways that we can arrange n different objects in any order. For example, the number of ways we can arrange the cards


The other tool that we need is the binomial coefficient. The binomial coefficient calculates the number of ways that we can choose k objects (without considering their order) out of n objects. It is defined as follows:
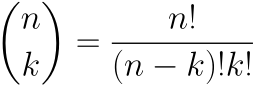
The expression on the left is the binomial coefficient and it is read as "n choose k." The right expression tells us how to calculate the binomial coefficient. As we can see, it uses the factorial function that we introduced before.
Given the six ghost girls
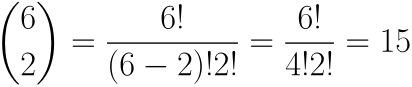
Hence, there are fifteen ways to choose two ghost girls from among the six.
When playing Yu-Gi-Oh!, however, we are not interested in the number of ways to align
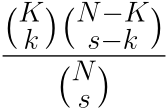
We can answer such questions with the help of the probability mass function of the hypergeometric distribution. Assume we have a deck of N cards (in our examples N will always be 40). Among those N cards there is a collection of K cards we are interested in. K might be the number of hand traps or the number of starter cards in our deck. We would like to know the probability to draw exactly k cards from among the K cards when we draw a sample of size s from our N-card deck. This probability is given by the number …
Concrete Examples
Let us fill these letters with some meaning. Assume we are running K=9 hand traps in our N=40-card deck. The size of our opening hand is s=5. If we want to know the probability to draw exactly k=2 hand traps out of the nine we are running, we simply have to compute the number:
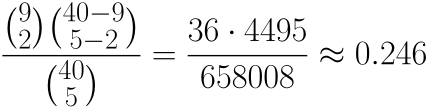
Hence, the probability to draw exactly two hand traps in your opening hand is roughly 24.6% when your 40-card deck includes nine hand traps.
There is even some intuition behind the calculation of this number. The first number in the numerator, 9 choose 2, calculates the number of ways to choose two hand traps from among the nine you are running. To complete your 5-card opening hand, you have to draw 5−2=3 additional cards from the remaining 40−9=31 cards in the deck. This is precisely the second term in the numerator. The product of these two numbers is divided by the total number of possible opening hands, that is, 40 choose 5.
Note that this also includes the cases of opening the same hand trap twice. For example, assume the nine hand traps you are running are three copies each of
Let us look at another example. If our N=40-card deck contains K=13 starter cards, the probability to draw exactly k=1 starter in our opening hand is:
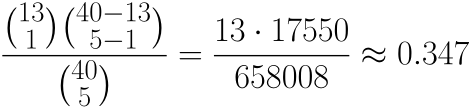
Thus, in about 34.7% of our opening hands we will have exactly one of the thirteen starter cards we are running. If, however, we want to know the probability to have at least one starter card out of thirteen in our opening hand, we simply have to sum up all the probabilities for k=1,2,3,4,5.


Tools for Calculating Probabilities
The good news is that you do not have to calculate all the binomial coefficients and factorials by hand on your own each time you build a new deck. There's a plethora of online calculators that you can use to calculate those probabilities. I usually use this one. I will now walk you through filling in the fields given for this calculator.
The population size corresponds to the number of cards in our deck (the number N above). The number of successes in the population corresponds to the number K above, for example the number of hand traps or the number of starter cards in our deck. The sample size corresponds to the number of cards we draw. For a going-first opening hand we plug in 5, for a going-second hand we plug in 6. The number of successes in the sample corresponds to the number of cards in our opening hand that should have the specific feature we are interested in, such as being a hand trap or starter. If we go back to the last example and fill in the numbers 40, 13, 5, and 1 from top to bottom and hit calculate, we will see that the probability to draw exactly one starter out of thirteen is about 0.347, just as above.
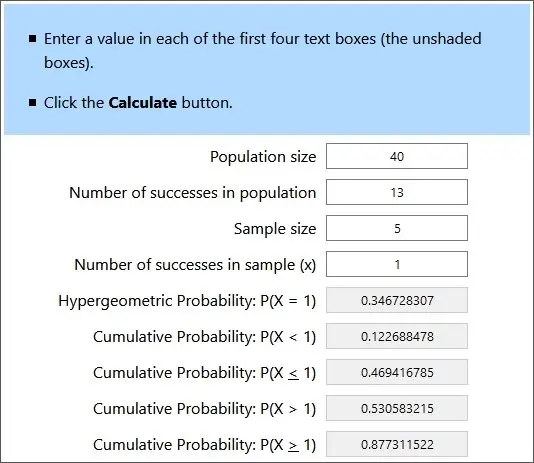
However, the calculator has calculated much more for us. Very often, we do not mind drawing more than one starter. The calculator has also calculated the cumulative probabilities for us. The last one, P(X≥1), gives us the probability to draw at least one out of our thirteen starters in our opening hand. As we can see, that probability is about 87.7% when we go first. If we only played seven starters, the percentage to draw at least one of them in our opening hand would decrease to 63.9%. You can try this out yourself.
A Probability Table for 40-Card Decks
To make life even easier for you, I have written a computer program that calculated the probabilities for a 40-card deck and arranged all the information in the following table:
| # hand traps | % at least 1 | % exactly 1 | % exactly 2 | % exactly 3 | % exactly 4 |
|---|---|---|---|---|---|
| 1 | 12.5 | 12.5 | 0 | 0 | 0 |
| 2 | 23.7 | 22.4 | 1.3 | 0 | 0 |
| 3 | 33.8 | 30.1 | 3.5 | 0.1 | 0 |
| 4 | 42.7 | 35.8 | 6.5 | 0.4 | 0 |
| 5 | 50.7 | 39.8 | 9.9 | 0.9 | 0 |
| 6 | 57.7 | 42.3 | 13.6 | 1.7 | 0.1 |
| 7 | 63.9 | 43.5 | 17.4 | 2.8 | 0.2 |
| 8 | 69.4 | 43.7 | 21.1 | 4.2 | 0.3 |
| 9 | 74.2 | 43 | 24.6 | 5.9 | 0.6 |
| 10 | 78.3 | 41.6 | 27.8 | 7.9 | 1 |
| 11 | 82 | 39.7 | 30.5 | 10.2 | 1.5 |
| 12 | 85.1 | 37.3 | 32.9 | 12.6 | 2.1 |
| 13 | 87.7 | 34.7 | 34.7 | 15.3 | 2.9 |
| 14 | 90 | 31.8 | 36 | 18 | 4 |
| 15 | 91.9 | 28.8 | 36.7 | 20.7 | 5.2 |
The first column contains the total number of hand traps in the deck. Here, "hand traps" is only a placeholder. It could just as well be starters, extenders, or any other card feature you like. The second column is probably the most interesting one. It tells you the probability to draw at least one hand trap in your opening hand. The other columns give you the probabilities to draw an exact number of hand traps in your opening hand. For example, there is a 57.7% chance to open at least one hand trap when you are running a total of six in your 40-card deck. In 42.3% of the cases you will open exactly one hand trap and in 13.6% of your opening hands you will have two. Running only five hand traps will result in you opening at least one hand traps in about every other game.
You can use this table to read off the probabilities for all sorts of events. Assume you side in three copies of
Please note that these are the probabilities for a 40-card deck and an opening hand of five cards. The probabilities for decks above 40 cards will decrease while those of going-second hands in a 40-card deck will increase. Nevertheless, you now have all the tools at your disposal to calculate many probabilities related to deck design yourself.
I hope that this article has helped you to get a better understanding of deck building in general. Moreover, I encourage you to check the probabilities the next time when you notice that your deck does not open the right starter cards frequently enough. Very often you'll find that the percentages are indeed too low. If there are any other probability-related questions, let me know down in the comments!
Opinions expressed in this article are those of the author and not necessarily Cardmarket.