
Entering a Modern Data World
In last week's article, we introduced the Modern format, and reviewed its development over the past months. If you did not read it yet and aren't familiar with modern Modern, I very much suggest that you at least give a look, since that article was written as a prelude to this article. At the end of it, we briefly touched upon the first two weeks of results after the bannings, including some graphs to visualize them and even a tier list. As promised, this article shows how I arrived at that tier list. We will also add more data to the analysis and look at some not-so-new archetypes appearing in the results.
The Magic Online Event Structure

Under the current circumstances, most Modern events take place on Magic Online (MTGO). They usually are official events, with results posted on Wizards of the Coast's website the day after, but third parties (such as Manatraders and Nerd Rage Gaming) also organize tournaments. The official Wizards events mostly take three forms:
-
Leagues consist of five matches that you can play whenever you want. There's no ranking (except based on the number of 5-0s after a few months when you play a lot of them) and rewards are based solely on the number of victories you earn in those five matches. The way Wizards publish the results of these events is subject to heavy criticism. They only post, twice a week, 5-0 decks with at least twenty cards difference compared to all the other 5-0 decks published in recent days. As such, rather than yielding information on archetype performance, these posts merely serve as an indicator of the diversity of the format. We cannot use League results for our analysis as long as they keep the same structure.
-
Preliminaries happen once each day of the week outside of the weekends and are four-round events. You can see them as a super competitive form of FNM, with a high entry cost, high rewards, and high-level players. Ever since a change in December 2020, only players hitting a 3-1 or a 4-0 record have their decklist published. These events do not provide a ranking, just a score. Alas, the mentioned change decreased both the accuracy of the data and the number of data points. So we do not use them today, but in the next article we will try to compare the data with or without Preliminary results.
-
Challenges (and other major events) gather dozens if not hundreds of players and take place each Saturday and Sunday. They can be seen as smaller online Grands Prix, with an average number of Swiss rounds between seven and eight, plus a Top 8. Sometimes they are replaced with even bigger events, such as Pro Tour Qualifiers or Showcase Challenges, but the structure is similar, they just have bigger stakes. You can find the details of Magic Online's premier play structure here. Events of this category only have their Top 32 decks published, along with a ranking and a score for each.
Note that the score of each deck is the triple of the number of wins. Indeed, each win grants three points, whereas a defeat does not grant any. Besides, we also know the number of rounds of each event, which means that we can determine the win rate of each deck by dividing the number of wins by the number of matches played. Since we also have the player name, the decklist, and the archetype name of each deck, we can determine the average win rate of each player, each card, and each archetype, in addition to their presence. It is even possible to go more in depth, especially for the cards, since we can get the full card data on MTGJSON. This way we can filter by set, by color, by type, by name, or even by artist for instance.
The unofficial events we mentioned follow the same structure as the official major events, except for Manatraders who first have a qualification stage. However, these organizers publish the entirety of the results rather than just the Top 32. For result analysis purposes, we only keep the Top 32 of these events to be able to compare them to the official major events for which we only have the Top 32. The resulting data set is a "winner's metagame" rather than an accurate picture of the metagame at large (which we cannot have anyway). Still, we will share some data from those events when they happen, in addition to the review of the Top 32. The next article will also provide a comparison of the data with or without these events, just like we will try adding the Preliminary results, but today we already have enough to cover.
TL;DR: we can compute the win rate and the presence (proportion) of almost anything in our data set. Due to the nature of the results (limited to Top 32 decklists) we have to call this the "winner's metagame." And we can get that data for each archetype, player, or card.
Do These Programs Also Make Coffee?
The results of those events are collected (scraped) by Reddit user Phelps-san, who has also developed a program to parse those results and recognize the archetype of each deck. They are then published in a practical format, such as JSON or CSV.
With that file, I can finally use my own program to generate graphs and provide an analysis of the events in spreadsheets. Do you want to know something about the data? For instance, which archetype playing Kaldheim cards with art by Magali Villeneuve appeared in the first eleven days after the bannings, its win rate, the URL of the events, and the decklists? The program can compute all of that and export it to a CSV, JSON, TXT, or XLSX file.
Four … Uhm, Three
We've now had four weeks worth of results since the bannings … Or at least that is what I wanted to say. In reality, we do not have four weeks of results because Wizards have inexplicably failed to update their website with new MTGO decklists since March 10!
So we only have three weeks of data to cover. What makes this even more disappointing is that this past weekend had not just two but three major events: two Challenges and one PTQ. At least we got some information about those events via Twitter. For instance, we've heard from the Heliod Combo player who won the PTQ, from the Esper Control player who won the Saturday Challenge, and about the same deck reaching the Top 4 of the Sunday Challenge. We also gleaned some other decklists from the Top 8s of those events, such as Blue-Red Kiki Exarch Combo, Jund Shadow, Mardu Stoneblade, Eldrazi Tron, and Four-Color Living End.
Unfortunately, we can only add full Top 32s to our collection, lest we destroy the homogeneity and comparability of our data. Here are the events we do cover.
List of MTGO Major Events Between 2021-02-17 and 2021-03-08:
Modern Challenge 2021-02-20
Modern Challenge 2021-02-21
Modern Challenge 2021-02-27
Modern Challenge 2021-02-28
Modern Showcase Challenge 2021-03-06
Modern Challenge 2021-03-07
Manatraders Series Modern February 2021-02-28
NRG Series Open Modern February 2021-02-21
Some Quick Stats:
Number of decks in the data: 256
Number of different players in the data: 213
Number of different cards in the data: 740
Number of exact archetypes in the data: 54
Number of super archetypes in the data: 42
Number of rounds played (with Top 8): 2068
Average number of Swiss rounds: 7.75
Minimum number of Swiss rounds: 7
Maximum number of Swiss rounds: 9
Number of events in the data: 8
While we do not have the data to provide a picture of the overall metagame, we can at least try to see which decks had the best performance, and to do so, we can count the number of performances (that ended in the Top 32) and measure the performances themselves (the average number of points per round or the win rate). To be accurate, instead of the number of copies of each archetype, we use as our presence metric the number of matches each archetype played. This allows us to weight the results depending on their "importance" (the more matches a deck played, the longer the event was, and/or it reached the Top 8). We will see in a later article what we can do for pure metagame presence based on number of copies, and compare it to the presence based on number of matches.
Presence, Performance, Percentages
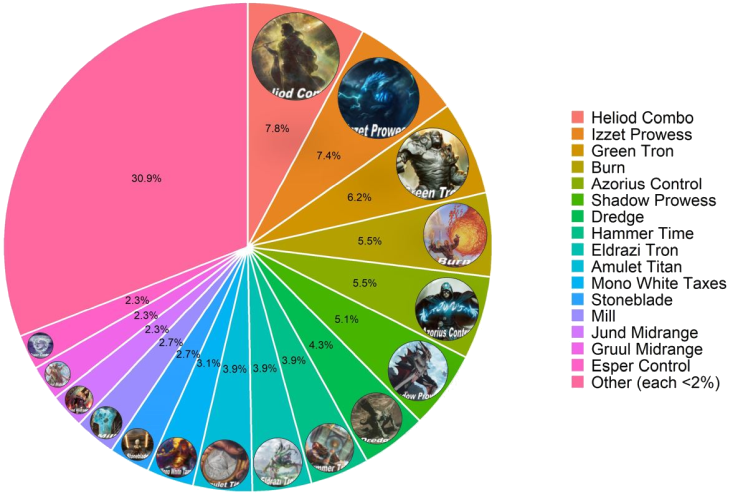
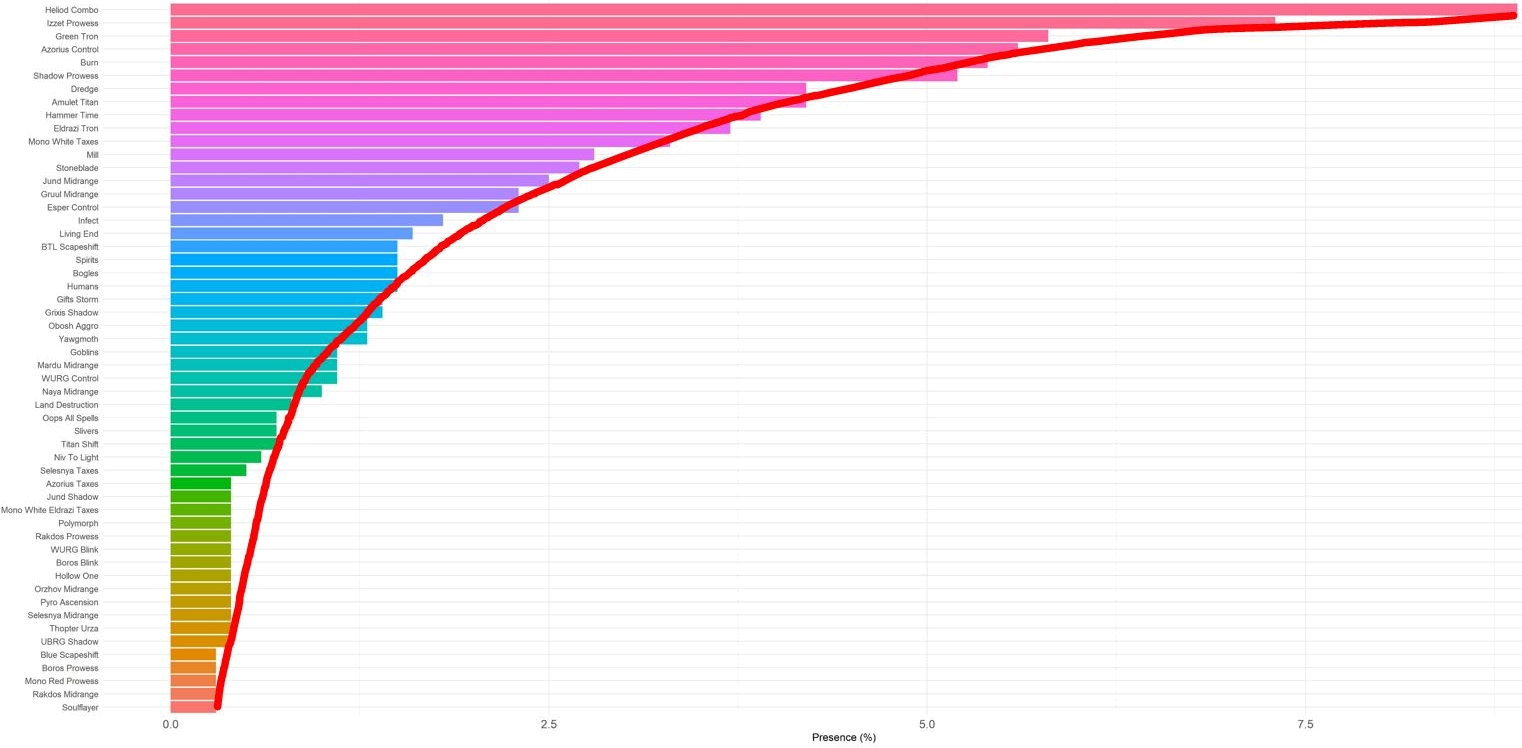
Let us start with the presence of each archetype in the Top 32s, weighted by matches:
Not many changes to comment on with only a single additional week of data. Azorius Control lost two places, Shadow Prowess traded its position with Hammer Time, Amulet Titan rose a little while Mill fell … And Heliod Combo and Izzet Prowess switched their places. We also note that
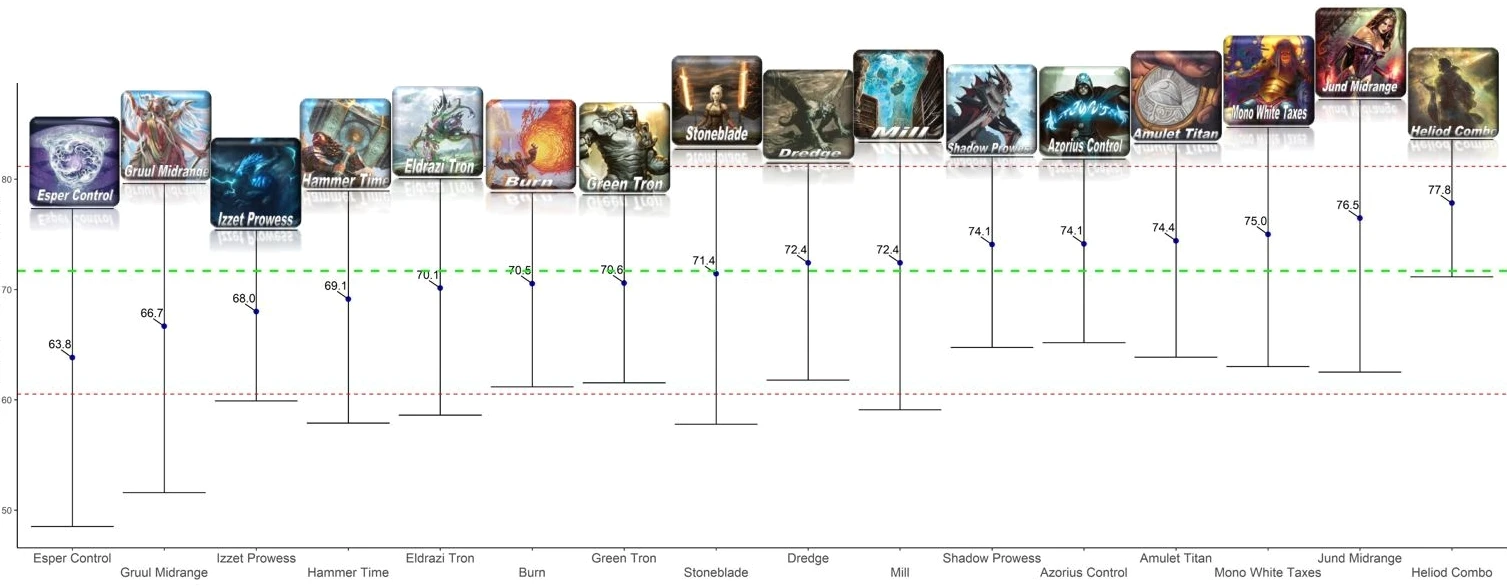
We also have the win rate for each of those archetype, as mentioned previously, and even a confidence interval. The following shows only the most played archetypes to retain a degree of readability.
Wait, aren't those figures too high? If you assume that a win rate should be around 50%, indeed. But these are win rates of decks that reached the Top 32 of an event, so most of the time they have a win rate of at least 60% if not higher.
It is interesting to see that Heliod Combo has both the highest presence and the highest win rate among the archetypes (filtered to keep only the most represented decks). So we can infer just from those two graphs that it must be the best archetype in the format right now—which is an opinion that seems to be shared by most grinders from what you can gather online. However, all the other archetypes do not have a win rate that looks to be correlated to their presence. It is particularly striking with Izzet Prowess (with a high presence but a terrible win rate) and Jund Midrange (the opposite case). Since we take extreme examples, in the last part of this article you will see that, if you take the data of an entire tournament, like Manatraders' February event, Jund Midrange might not be as good as this graph would suggest. On the other hand, the lower quality of Izzet Prowess's results seems to be confirmed.
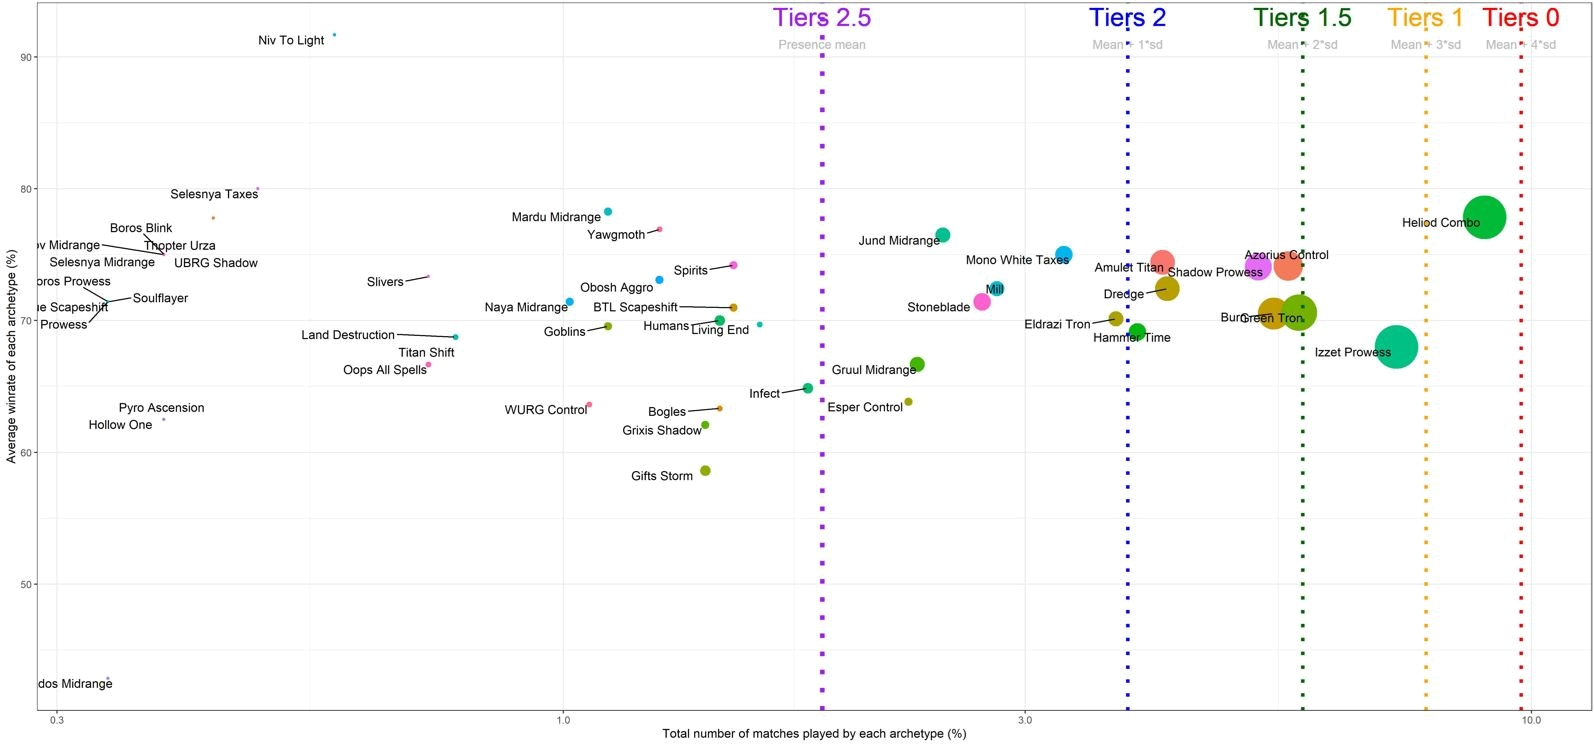
For a better visualization of that phenomenon, we can show both metrics in the same graph, with the win rate on the vertical axis and presence on the x axis:
Here you can see the performance of all the archetypes present in the data based on their win rate and presence. In particular, we can see Heliod at the top right corner, which appears to combine the best of both worlds. Two other points catch the eye. First, Niv to Light, with the single best win rate in the data set. The explanation, however, is simple: the deck only appeared once in all of the eight Top 32s, but it took down an entire event, only losing once in the Swiss rounds.
The opposite can be said about Rakdos Midrange, at the bottom left corner, which reached the Top 32 of the NRG Series almost by accident. The player did not drop from the event and played until the end, and because so many others did, their 3-4 record turned out to be good enough for a 29th place. Note that our data set contains just a single copy of either deck. Niv To Light appears much higher in terms of presence because it played twelve matches (nine Swiss rounds and three in the Top 8) whereas Rakdos Midrange only played seven. The possible existence of such extreme outliers is another reason why we should disregard all but the most played decks going forward.
What Was Old Is New Again
My previous article showed off decklists for many archetypes that had posted relevant results between Zendikar Rising and Kaldheim, as well as a few new ones that appeared between Kaldheim and the bannings. However, we did not cover some archetypes that came back afterward. The new powered-down Modern allowed a lot of former fan favorites to return. So it is time to complete this review of the format's main archetypes. We have no new big mana or aggro deck to introduce today, but true midrange decks are back!
Midrange
Jund Midrange
The most iconic midrange deck of the Modern format, Jund tries to deplete the opponent's resources with discard spells such as
| Jund Midrange by Golgarburr, 3rd at MTGO Challenge on February 27 | ||
|---|---|---|
| Main Deck | Sideboard | |
|
|
|
Stoneblade
Usually known as a deck running
| WURG Stoneblade by Promidnightz, 6th at Manatraders Series on February 28 | ||
|---|---|---|
| Main Deck | Sideboard | |
|
|
|
Gruul Midrange
Known as Ponza in the past (legend says that the deck's creator was eating a pizza "Ponza" while streaming it, although the name dates back at least to the late 1990s), it initially was a deck focused on land destruction, loading up on cards like
| Gruul Midrange by darius89, 14th at Manatraders Series on February 27 | ||
|---|---|---|
| Main Deck | Sideboard | |
|
|
|
Combo
Dredge
Historically the main graveyard deck in Modern, Dredge uses cards with the eponymous ability such as
| Dredge by Ryan100495, 3rd at MTGO Challenge on March 7 | ||
|---|---|---|
| Main Deck | Sideboard | |
|
|
|
Control
Azorius Control
With the departure of
Blue and white can answer any spell or permanent, and using fewer colors means you can play more
| Azorius Control by Oscar_Franco, 1st at MTGO Challenge on February 20 | ||
|---|---|---|
| Main Deck | Sideboard | |
|
|
|
Esper Control
You can also often find a variation that splashes black for: spot removal such as
| Esper Control by TSPJendrek, 19th at MTGO Showcase Challenge on March 6 | ||
|---|---|---|
| Main Deck | Sideboard | |
|
|
|
Finding a "Best" Deck
Now that you are familiar with all the main archetypes in the data, how can we rank them? It is only possible to say that one deck is better than another when we compare a single value. However, we have two values for each deck: the presence in the winner's metagame and the win rate. We could choose to keep only one of these two values for each deck. However, neither is very reliable.
For the presence, it would be normal for a deck to have a 10% presence in the winner's metagame if it had a 10% presence in the entire metagame. Conversely, if a deck had a 30% presence in the initial metagame, and it only made up 10% of the winner's metagame, that would mean that the deck had a poor performance. As a consequence, since we do not have access to the full metagame breakdown, the winner's metagame is not enough of a metric to rank a deck. As for the win rate, it is not very reliable either because we do not have enough results to get small confidence intervals. Besides, again, it suffers from survivorship bias.
So we should look for a way to combine both values into a single one. First, we keep only the decks whose presence is above the average presence. This allows us to retain a reasonable number of decks, otherwise we would have way too many archetypes to derive useful information, as you saw on the two-dimensional graph earlier. The idea comes from Modern Nexus.
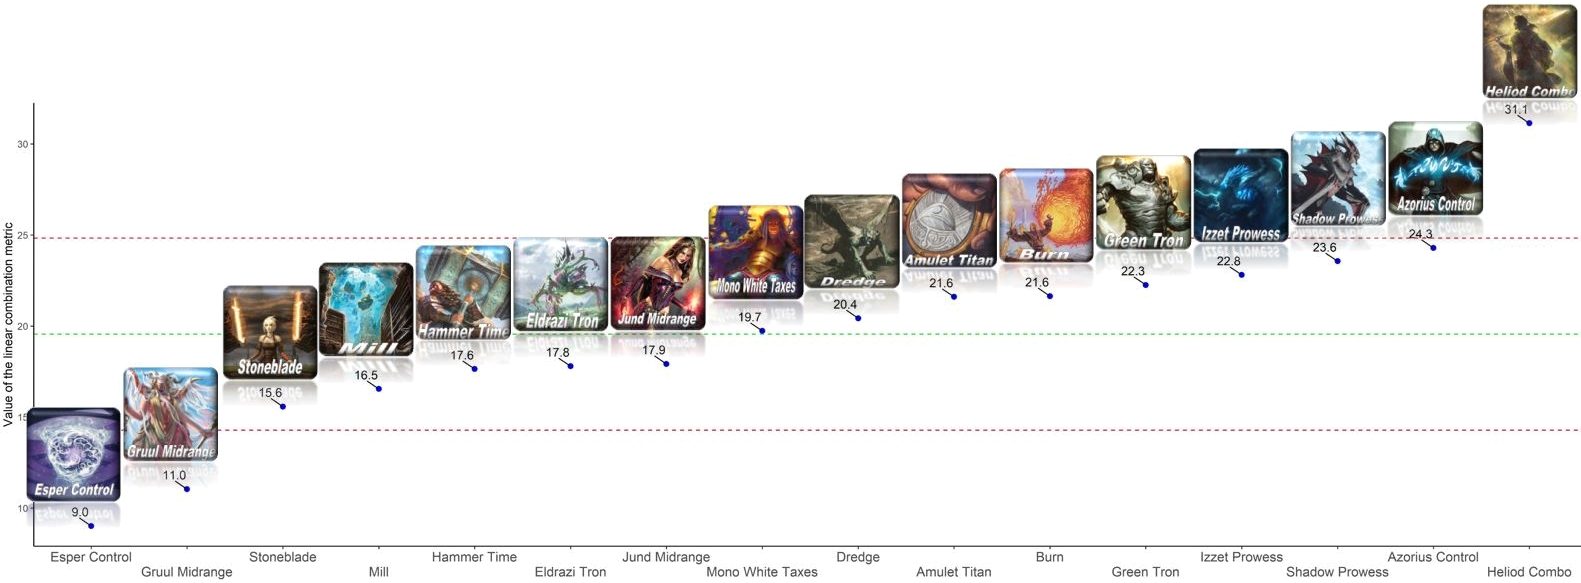
Since the above is just "zooming in" on the previous graph, it is normal that Heliod Combo appears again as the best deck from both metrics, alone in the top right corner. On the other hand, Gruul Midrange and Esper Control look pretty weak. This is interesting because that would most likely have changed with the fourth week of results, since Esper Control had a great showing this weekend (winning one Challenge and reaching the Top 4 in the other). Besides, one of the pilots, TSP Jendrek, a well-known Magic Online Modern grinder and control brewer, is convinced that Esper Control is much better positioned than Azorius Control at the moment.
Lower Bound of the Win Rate's Confidence Intervals
A first estimation would be to compare the lower bound of the confidence interval on the win rate. Indeed, that confidence interval depends a lot on the number of matches played. (That is another reason why I use the number of matches played as indicator of the presence instead of the number of copies.) So it is a way to combine both metrics. Here is the ranking of the most represented decks based on that metric.
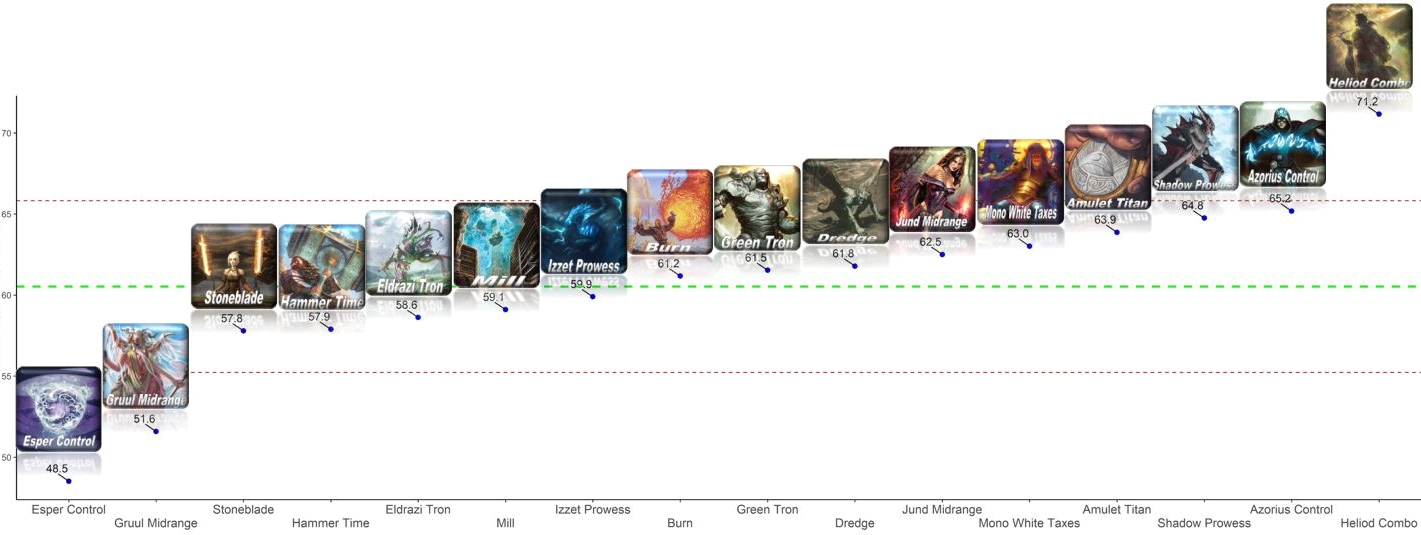
As expected, Heliod Combo is on top, followed by Shadow Prowess and Azorius Control. However, Izzet Prowess sits much lower, really hindered by its lower win rate. Indeed, this metric puts a lot of weight in the win rate, since it is mostly based on it.
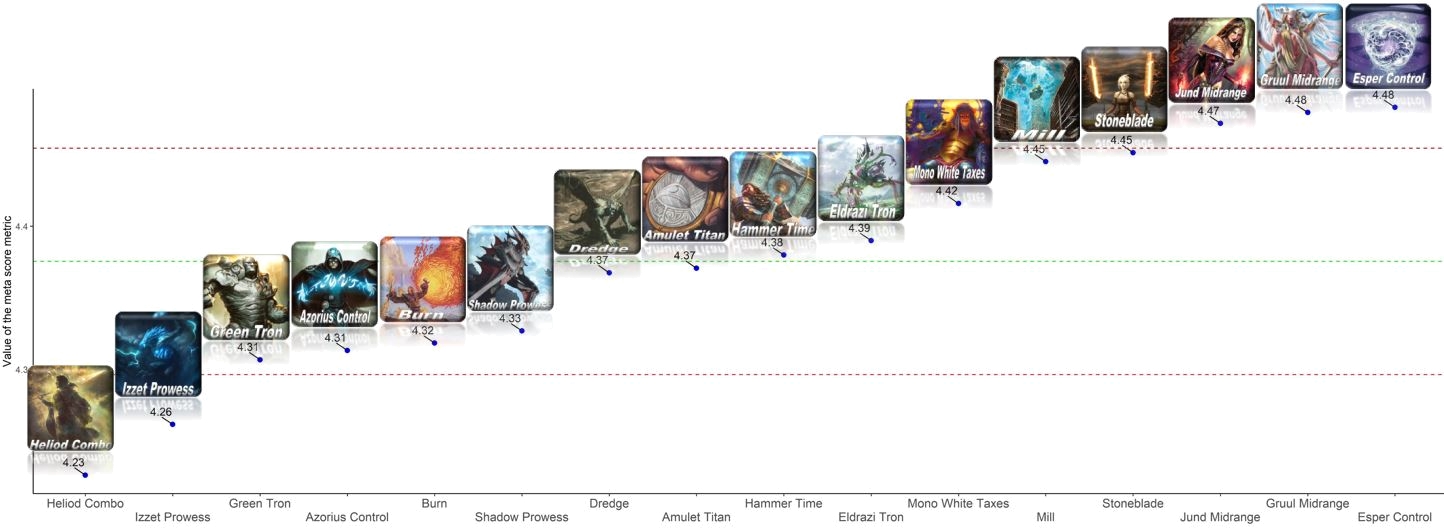
VS Meta Score: Distance to the Theoretical Best Deck
Developed by Hearthstone players, this metric generates a theoretical best deck, the "meta peak," which has the highest win rate and the highest presence. Then it computes the "distance" of each deck to that meta peak and ranks decks based on that distance. The smaller the distance, the stronger a deck is, so this time we find the best deck at the bottom. Here is the ranking of the most represented decks based on that metric.
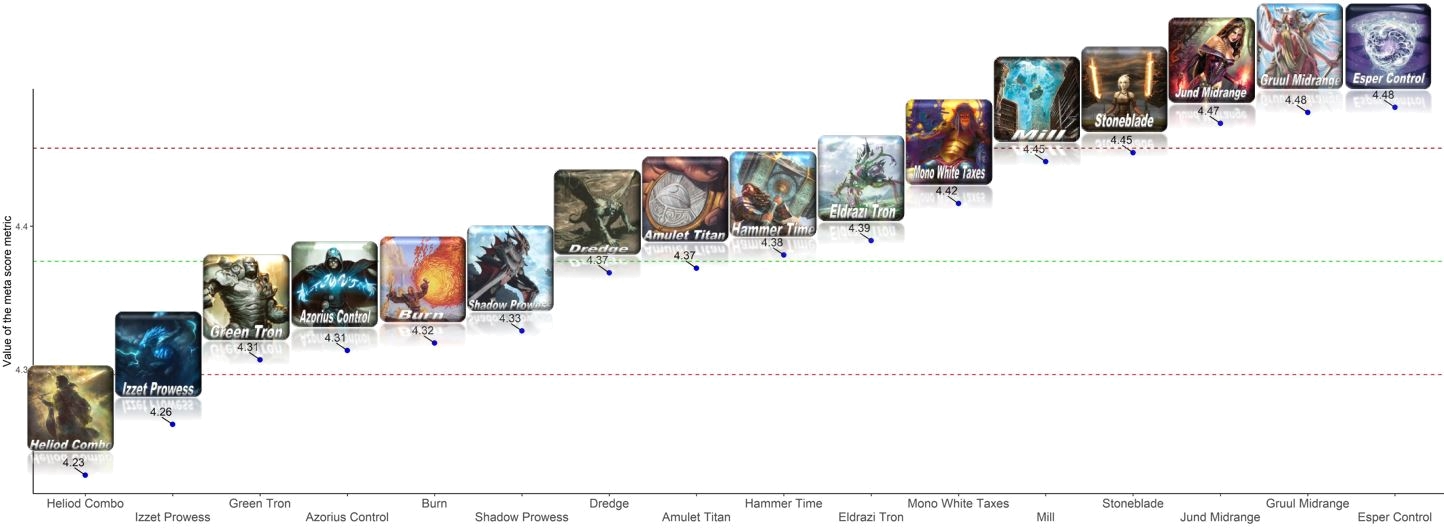
From that metric, we get of course Heliod Combo as the best deck, but now it is followed by Izzet Prowess. So this metric appears to value the presence much more than the win rate. It is possible that a transformation of the win rate is needed before applying this metric, as we will do below, but since the initial users did not employ one, the results are showcased as it is initially built.
Summing the Metrics
The last idea presented here is to sum both the presence and the win rate. In order to compare similar values, I transformed them so they are all contained between 0 and 1. To do so, for each metric, I start by subtracting the minimum value in that metric from all the values of that metric (making it start from 0) and then divide by the maximum value of that metric (so that the result is contained between 0 and 1). This way, I can get a score for each archetype through summing the value each metric provides for that archetype after the transformation, eventually multiplied by a weight, with a formula.

To be accurate, before applying this transformation, I chose to take the logarithm of the presence. Indeed, the presence appears to be exponentially distributed.
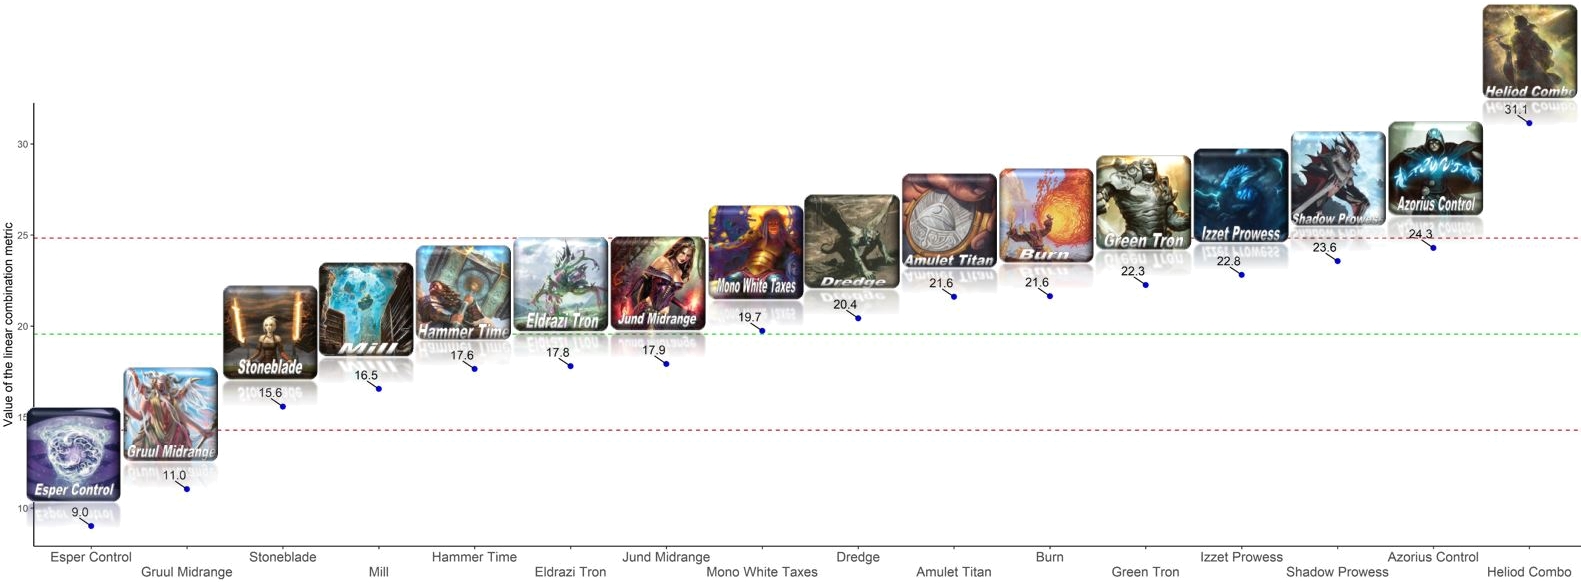
This is the metric I use to build a tier list as I found the results it provides to be very reasonable in practice. Indeed, I think it provides the best balance between the two initial metrics, the presence and the win rate. It is possible to use one of the two others mentioned above, though, especially the VS Meta Score, which also provides close results most of the time, maybe with the logarithmic transformation mentioned previously.
Crafting a Tier List
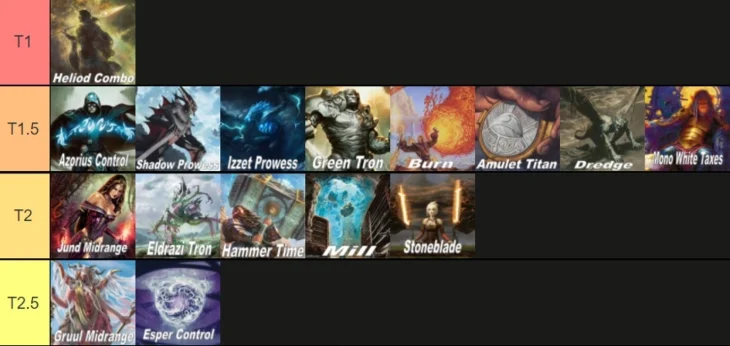
From here, we can finally build a tier list. To do so, we first take the average of our metric summing both the presence and win rate, what we can call unexpectedly the "sum metric." Its average is the green horizontal line you see on the graph above, and it cuts the data in half. Then we can split each half of the decks again with the value of the average more or less one standard deviation above and below—see the red lines on the graph. This way we get four tiers: 1, 1.5, 2, and 2.5, 1 being the best and 2.5 the worst. When there are large deviations, with a deck more than two standard deviations under or above the average, we can even create new tiers, below or above the initial ones. (Such would be the case for Heliod Combo here for instance, but it is alone in its tier anyway.) Here is what you get visually.
Bonus: Modern Series Full Results
Two unofficial major events took place since the bannings: the February 2021 Manatraders Series and the NRG Series MTGO Open. If you want to see what the results of a full tournament look like, and have an idea of what the actual metagame looks like, they might offer good resources. The NRG Series was relatively small, so we only have the metagame breakdown.
We also have the metagame breakdown for the Manatraders Series, but in addition a win rate matrix for the main archetypes was computed. Maybe you would like to see how all the archetypes performed and not just the most popular ones? Then you might be interested in the conversion rates to 6-3 and better results. This is where you can see Izzet Prowess and Jund Midrange really underperformed during the course of the biggest recent Modern event for which we have all the data.
Besides, this past weekend saw the most high-stake event in all of Magic Online: the Championship Showcase, seasons 2 and 3, awarding $20,000 to the winner alone. In these two small but extremely competitive events (since only players winning huge tournaments are able to qualify) the following decks were used. (You can find the lists here and there.)
4 Heliod Combo
3 Izzet Prowess
2 Azorius Control
1 Rakdos Prowess
1 Jund Shadow
1 Hammer Time
1 Bogles
1 Amulet Titan
1 Azorius Spirits
1 Oops All Spells
The two decks that went 3-0 in the Modern portion were Jund Shadow on Saturday and Heliod on Sunday.
Going Forward
With this article, I hope you have learned a few things about the structure of the MTGO events, what data organizers make available, and what we can use for analysis. We were able to visualize the performance of the main decks of the format, introduce the decklists of the archetypes we did not cover last time, and explain how to rank them.
My next article will cover metagame updates in the weeks to come and compare the Top 32 data with larger samples trying to represent the overall metagame. In the meantime, for regular Modern news, make sure to follow me on Twitter. Last, if you read this article until the end, you are likely to be interested in Modern, in which case you want to make sure not to miss the latest announcement about Modern Horizons 2, scheduled for release on June 11.
Opinions expressed in this article are those of the author and not necessarily Cardmarket.