
So I finished my master's thesis and therefore my whole path through university. I got the result and passed, which means I am now officially a Master of Education, even though my grade wasn't great (3.3). This was partly due to poor writing on my end, rather than the science being faulty, so thanks to Cardmarket for letting me write for them.
For some context you might want to read my previous article about my thesis. In it I explain what exactly I was doing and why.
The Data
As my thesis was written in German the graphics shown aren't exactly the same as in my thesis. I tried to translate everything as accurately as possible. All three of the graphics show different "two factor analysis of variance" (ANOVA) that are the core part of my thesis and also the most interesting part of it. Before I go into too much detail, let me explain the meaning of the terms used.
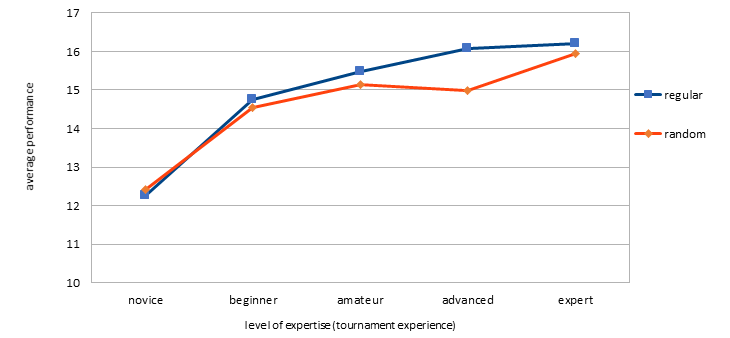
"Average performance" refers to the average of the number of correctly filled out cells in the memory tasks. (For more on those look into my first article on my thesis.) There were seven "random" and seven "regular" board states to memorize, so the orange/blue lines and points refer to participants' average score over those seven. The best possible score was 24 and the worst was zero. An example: The orange data point for "advanced" players refers to the average number of points people falling into that category scored for "random" game states, in this case roughly fifteen.
In the following I show three graphics. The first one uses what is my main distinction for "expertise"—what type of tournament experience participants had so far. It is split in ascending order into the following five categories:
| novice | has never played Magic |
| beginner | has never played a tournament, has played Magic |
| amateur | has played tournaments, but never competitive (REL) |
| advanced | has played competitive tournaments, but never professional |
| expert | has played professional tournaments |
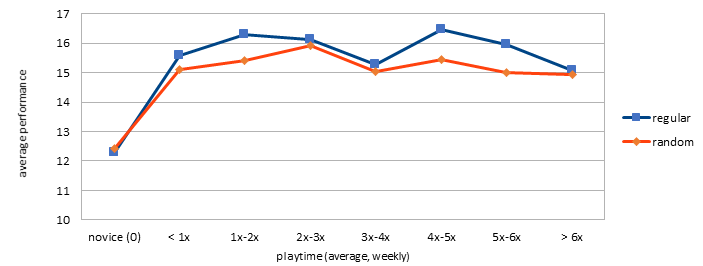
The second one uses average weekly playtime in the last year. It refers to days on which one or more games of Magic were played. While that certainly correlates with the actual amount of playtime, it certainly allows for a margin of error. I've made a distinction between novices and "<1x," which means less than once. This served not to lump inactive players together with non-players.
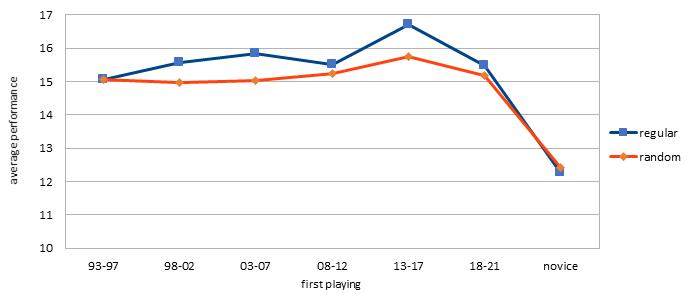
In the third and last graphic you can see how people performed based on when they started playing Magic ("first playing") from 1993 to now. It's divided into groups of five years each (four for 2018–2021) with novices here put after the rightmost category, because they have never played Magic.
The Discussion
The most interesting part first: This data supports the thesis that experts are better at memorizing and reconstructing board states. It also supports the notion that random board states diminish this advantage. This isn't very suprising, but nonetheless this was what I wanted to figure out. And I did, with a lot of help from all the people participating, that is.
That said the difference between "random" and "regular" board states is fairly small. It is significant to a level of 0.05, meaning the chance of it occuring randomly is smaller than 5%. Still, the change in how many cards Magic players of any skill level reconstruct correctly is never more than one.
For now this will have to suffice, but of course my methods have some areas in which they could be improved. Variations of the experiment might give more insight. Some things one could change in similar experiments include the usage of truly random board states instead of those that still have lands in their own rows, but that comes with the problem of getting rid of chunkability of lands for novices as well. It would be an interesting data point to look at in combination to the random and regular board states we have here, but not as a replacement.
There are a bunch of additional changes, many small, some bigger, that one could make to get more details, but I'll omit discussion of those not to bore you too much. Rather let's discuss some possible explanations for why those three graphics look the way they do!
Performance by Expertise
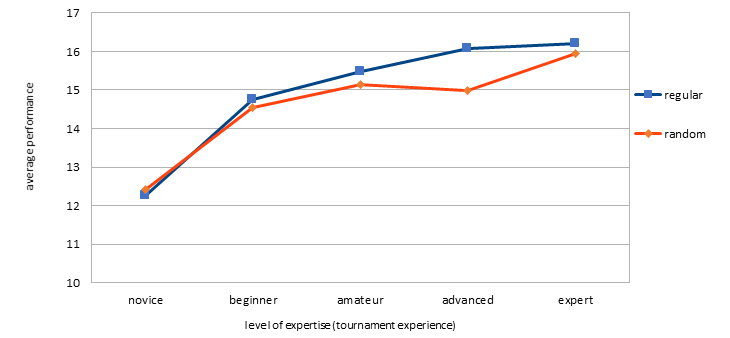
The first graphic seems quite straightforward for the most part. With rising skill level, at least on average, the number of cards people are able to reconstruct rises as well. There's one notable exception in the jump from amateur to advanced to expert, with amateurs having a fairly big gap in between random and regular board states.
Although I cannot know, I can certainly speculate on why that is the case. One possibility would be a change of perception in which perceiving board states as chunks of cards that interact with each other get stronger until the "advanced" level, but then there being another change in quality of perception going to experts. For those the gap is fairly small again, possibly explained by memorization of singular cards in more detail rather than chunks.
Again this is all speculation. It would've been nice to see what kind of mistakes differentiate the different skill levels and also to get some insight into how people actually handle the memorizing act. Alas, that didn't happen here as my thesis was long enough as is.
Performance by Playtime
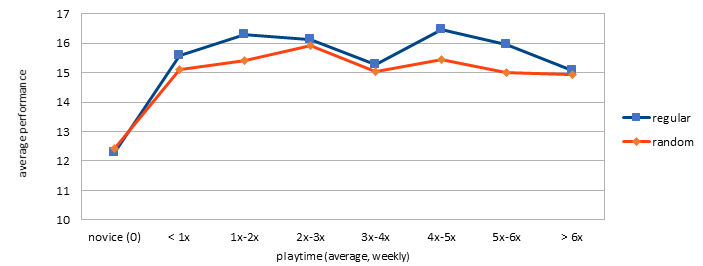
Finding a coherent explanation for the way the second graphic looks seems more difficult. People who play three to four times a week or more than five times performing worse than people playing one to two times a week doesn't seem to make sense immediately. I think this might just be me not having the best parameters here, but also some regular variance in the sample.
First I didn't check for active time in which people interact with Magic through content consumption and such, which definitely also matters for expertise, and I asked for days on which people play one or more times instead of just asking for hours of playtime. I believe both of these omissions can probably explain some of this graphic's weird look.
Performance by Starting Year
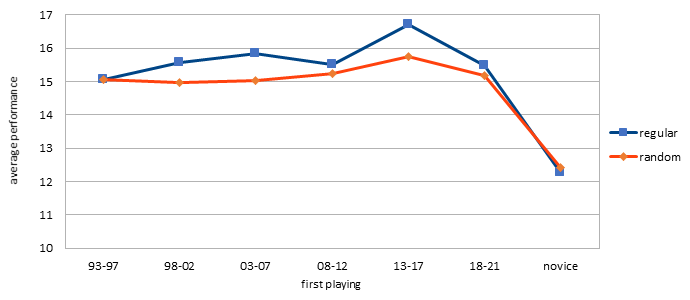
The last graphic using the first time people played Magic has a problem similar to the last one. It doesn't account for breaks, especially prolonged ones. Similar to the second graphic there is likely some correlation between the thing leading to expertise (playtime) and the thing I asked for (starting time), but introducing more elements of variance definitely doesn't help me find out the things I want to find out.
However, here I at least have some possible explanation for the graphic's structure. If we assume that there's a high likelihood of a more intensive interaction with Magic if you have only started somewhat recently and that how deeply you're enfranchised wanes over time, especially for longer periods of time, this could explain everything: People who started in 2018–2021 didn't have as much time to acquire expertise, which means the peak is a little before that. Meanwhile, people who've been playing for four or more years probably didn't take any breaks yet but also had a reasonably long time to become proficient at Magic.
This also fits in with the idea of decreasing marginal utility for just playing longer. A longer time with the game might actually increase the likelihood of losing interest or taking breaks. This seems like a reasonable explanation for the way the graphic looks. Again, all of this speculation is just that, speculation. The only thing we know for sure (meaning they are unlikely to appear randomly in my data) are that Magic players are better than novices at the memory tasks they got and that a player's edge over novices gets smaller for random board states, not by much, but by an significant amount.
Conclusion
Thanks again to everyone who helped me out with this thesis, be it by participating in the experiment or any other way! While it was sometimes a drag to work on this, it was nonetheless an enjoyable journey.
Until next time,
Kristof
Opinions expressed in this article are those of the author and not necessarily Cardmarket.